Results
Understand Results as derived summaries over a selected set of runs, grouped and filtered by experiment dimensions.
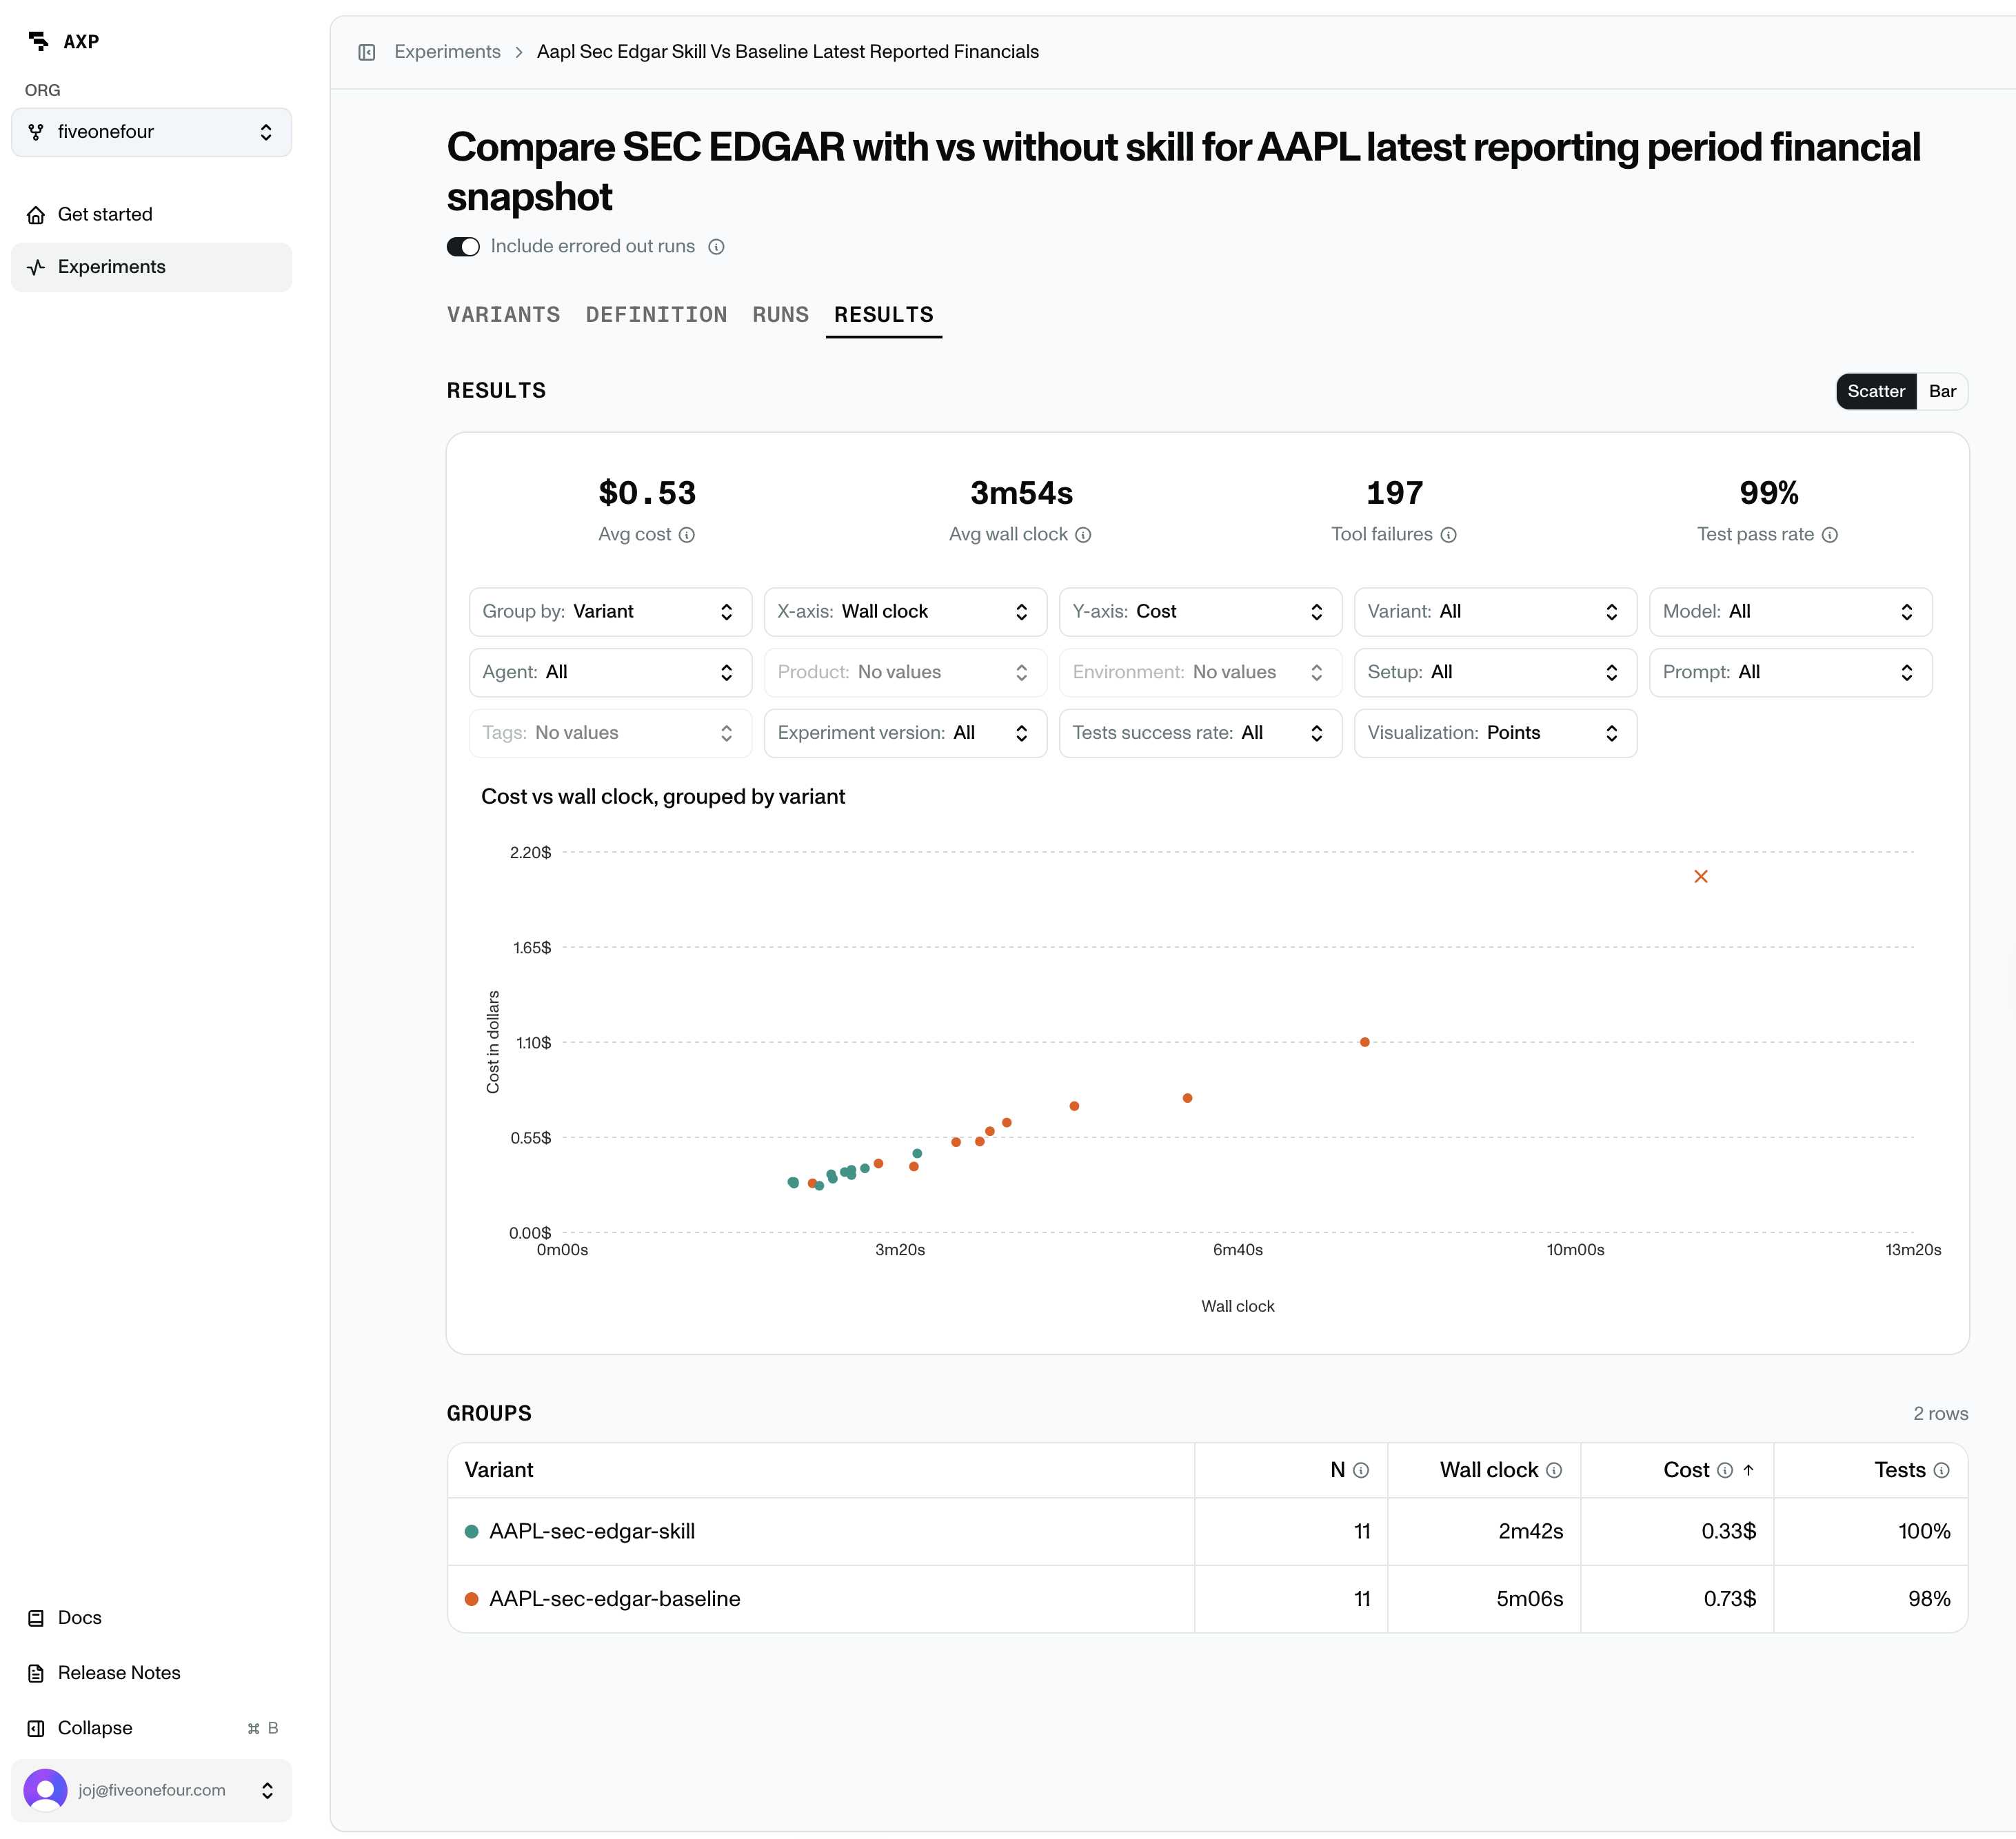
Results are the main way to explore data across many Runs. They let you visualize and compare how different combinations of prompts, models, products, and environments performed, then slice the data by any of those dimensions to answer narrower questions, like which product performed best across the same task.
Where to view results
Results are accessible in the Results tab of the AXP dashboard. For custom SQL analysis, use axp query for uploaded platform data or axp local query for local/downloaded run data.
What results contain
Each Results view is defined by three choices:
- Metrics: what to measure, such as cost, tokens, wall-clock time, tool calls, and test outcomes.
- Filters: which runs to include, such as one experiment version, variant, model, prompt, product, or environment.
- Grouping: how to split the selected runs. This is how you can compare metrics across different prompts, models, products, or environments.
The result is a summary of the selected run set. For example, you can compare average cost by variant, test pass rate by model, or wall-clock time across repeated runs of the same configuration.
How to read result data
Results views show both individual run data and grouped summaries. Grouped summaries use averages or totals across all runs in that group, so always check N before trusting a comparison. A group with 50 runs is more reliable than a group with one run.
Common metrics:
- Cost: total or average model spend.
- Wall clock: elapsed runtime.
- Tokens: input and output tokens used by the agent.
- Tool calls: tools the agent used while working.
- Tool failures: tool calls that failed.
- Tests failed: number of failed application or introspection tests.
- Test pass rate: passed tests divided by total tests.
Filtering and grouping results
The objects you define in experiment YAML become the core dimensions you use to filter, group, and visualize results. If you define multiple prompts, models, products, or environments, Results lets you slice the run data along those axes. Results also includes filters that come from execution, such as run status and test success.
Experiment-defined dimensions:
- Variant: the full resolved combination that produced a run.
- Agent: the coding agent that attempted the task.
- Model: the model used by that agent.
- Prompt: the task text or prompt id the agent worked from.
- Product: the product or product version being tested.
- Environment: the sandbox setup the agent worked inside.
- Experiment version: the experiment definition used for the run.
You can also apply filters that are derived from the Run itself:
- Run status: whether the run passed, failed, errored, timed out, or hit another terminal state.
- Test success: whether all tests passed for a run or group of runs.